Advanced
Statistical Analysis of Measured Data
The Sample Statistics screen provides a useful
tool for computing statistics for a selected subset of measured
values. This screen also provides an option for conducting Normality
tests for sample sizes of 50 or more. The Sample Statistics screen is
accessed via the Tools menu of the Measurement
Data Entry Worksheets or the Statistics menu of the Error
Source Worksheets. Key screen features are described below.
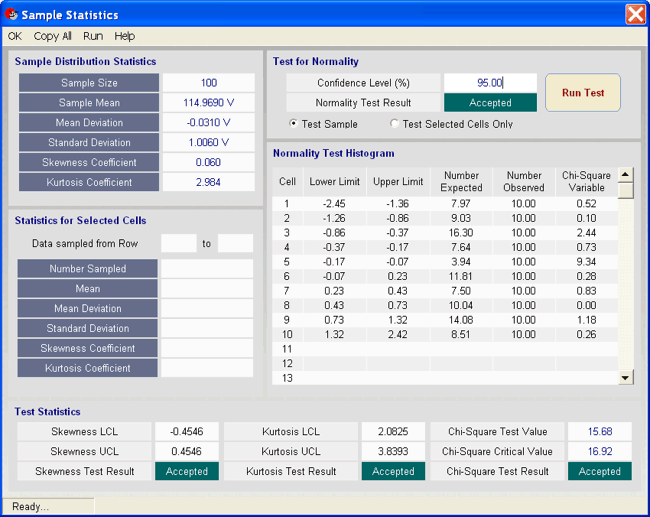
Sample
Distribution Statistics
The upper left portion of the screen displays key statistical
information for the entire sample of data entered in the Measurement Data Entry
Worksheet or the Error Source Worksheet.
Statistics
for Selected Cells
This
section of the screen allows the user compute statistics for a selected
sample subset. The desired subset is specified by selecting a range
of rows of the sample data entered in Measurement Data Entry Worksheet or
the Error Source Worksheet.
Test
for Normality
The
Sample Statistics screen also contains an option for testing the normality of samples of data, with a sample size of at least 50.
Normality testing is used to determine if the sampled data can be assumed to be normally distributed.
Normality testing can be conducted on the entire sample or on the selected
cells only.
Normality
testing in UncertaintyAnalyzer is done using three different tests:
A chi-square "goodness of fit" test, a "skewness" test
and a "kurtosis" test. of a
sample in comparison with what is expected of samples from a normally
distributed population. The resulting Normality Test Statistics
are displayed in the bottom portion of the screen. |

 UncertaintyAnalyzer 3.0 - Sample
Statistics Screen
UncertaintyAnalyzer 3.0 - Sample
Statistics Screen